In software development, it's not uncommon for performance optimization to happen later in the development cycle. This allows earlier development stages to focus on new features and easy-to-maintain code. Creating a new feature for any software is fun; finding ways to optimize code and improve its performance is challenging and rewarding. This process involves carefully analyzing the code, using profilers and specialized tools to identify poorly performing areas, and considering alternative code that runs faster.
In this post, I will cover the performance optimizations we made to Orchestrator, what was used to compare Orchestrator's visual scripting to GDScript, and the net results of those optimizations.
Tooling
We will test using Windows 11 Pro 23H2 Build 22631.3155 with an Intel i9-10900K 3.7GHz, 64GB, and an Nvidia GeForce RTX 3080 Ti with 12GB of memory using all solid-state drives.
The Godot editor is a custom build based on the current 4.3 master branch, with debug symbols enabled in a release build to allow performance tooling to identify hotspots and function call timings.
Throughout this post, I will refer to Intel's VTune Profiler, an excellent tool to identify timings of function calls to identify where you may have Hotspots within your code, allowing you to zoom into what parts of the code are consuming the most cycles and how you can improve those cycles.
fibonacci.gd (GDScript)
extends Node2D

const MAX_ITERATIONS = 30

func _ready() -> void:
    var start = Time.get_unix_time_from_system()
    for i in range(0, MAX_ITERATIONS + 1):
        fibonacci(i);
    var end = Time.get_unix_time_from_system()
    print(str(end - start))

func fibonacci(x: int) -> int:
    if x == 0:
        return 0
    elif x == 1:
        return 1
    else:
        return fibonacci(x - 1) + fibonacci(x - 2)
The following table outlines the time taken for the above example for each MAX_ITERATIONS from 1 to 30:
| Iteration(s) | Time |
|---|---|
| 1 to 13 | 0s |
| 14 | 0.00099992752075s |
| 15 | 0.0020000934600s |
| 16 | 0.00399994850159s |
| 17 | 0.00600004196167s |
| 18 | 0.00900006294250s |
| 19 | 0.0169999599456s |
| 20 | 0.0259997844696s |
| 21 | 0.0429998283386s |
| 22 | 0.069000057220s |
| 23 | 0.112999160766s |
| 24 | 0.183000087738s |
| 25 | 0.285000085830s |
| 26 | 0.459000110626s |
| 27 | 0.756999694824s |
| 28 | 1.21399986648s |
| 29 | 1.98099946954s |
| 30 | 3.22799925613s |
fibonacci.os (Orchestrator Script)
The Orchestrator script is a bit more involved as it tends to be more verbose to express the same type of code in a text-based language in a visual language. For the sake of readability, we've split the Orchestration into two logical screenshots, one that shows the _ready function and another that shows the fibonacci function:
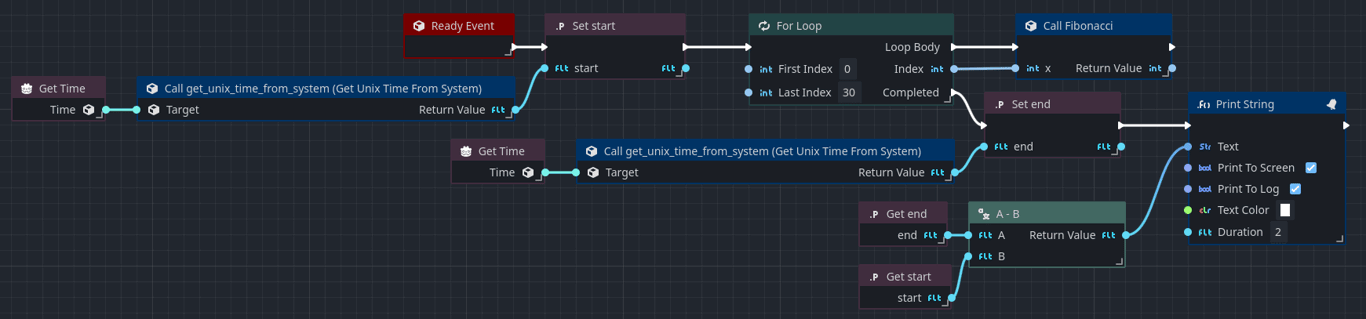
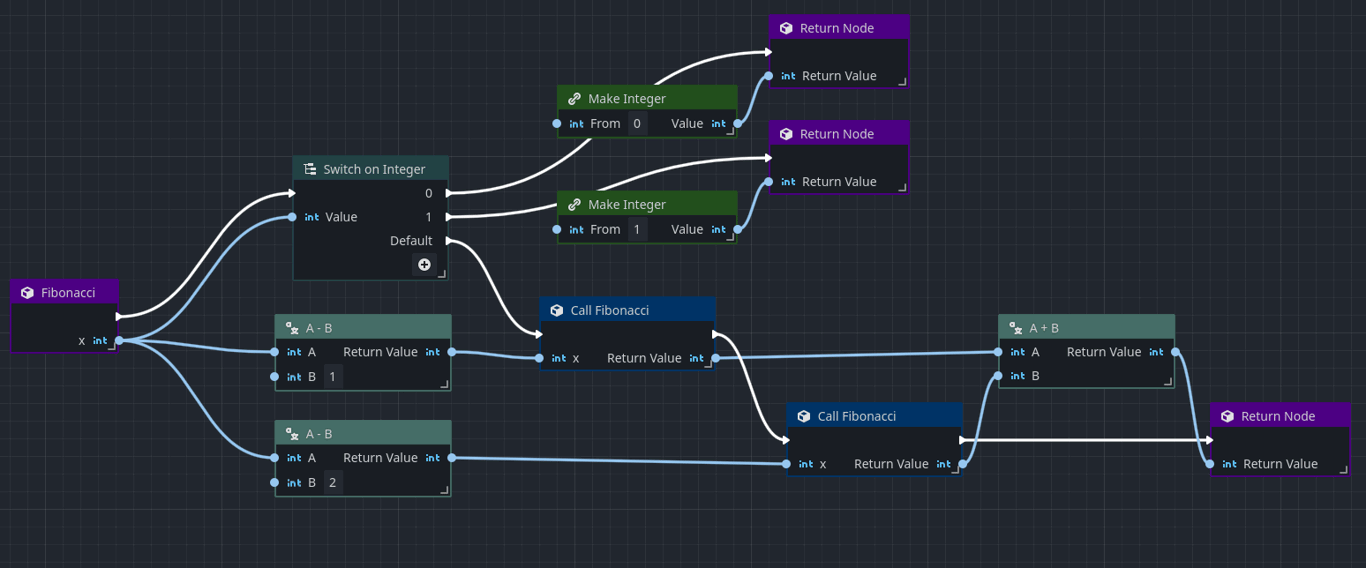
We can logically see that the code expressed by Orchestrator matches that of GDScript.
The Baseline
In the former section, we covered the GDScript baseline performance numbers. Now, let's look at exactly how Orchestrator 2.0.dev2 compares to those numbers. For brevity, I'm only going to initially test the iterations at the breakpoints of 10, 20, 25, and 30:
| Iterations | Time | Difference to GDScript |
|---|---|---|
| 10 | 0.00399994850159s | +0.00399994850159s |
| 20 | 0.45800018310547s | +0.43200039863587s |
| 25 | 4.96599984169006s | +4.68099975585937s |
| 30 | 56.39600014686858s | +53.16800089073730s |
As we can see, Orchestrator's performance worsens as we add additional iterations. Orchestrator is 1647% slower at max iterations than GDScript. With the baseline, let's get started.
Identifying Problems
Using 30 iterations, I ran Orchestrator through VTune, Intel's performance profiler and analysis tool. I specifically ran the HotSpot benchmark as I wanted to understand where all the problematic function call areas are. This requires both the editor and the library to be compiled using release-build but with debug information/symbols so that the tooling can correctly decode function calls to names, making the process easier.
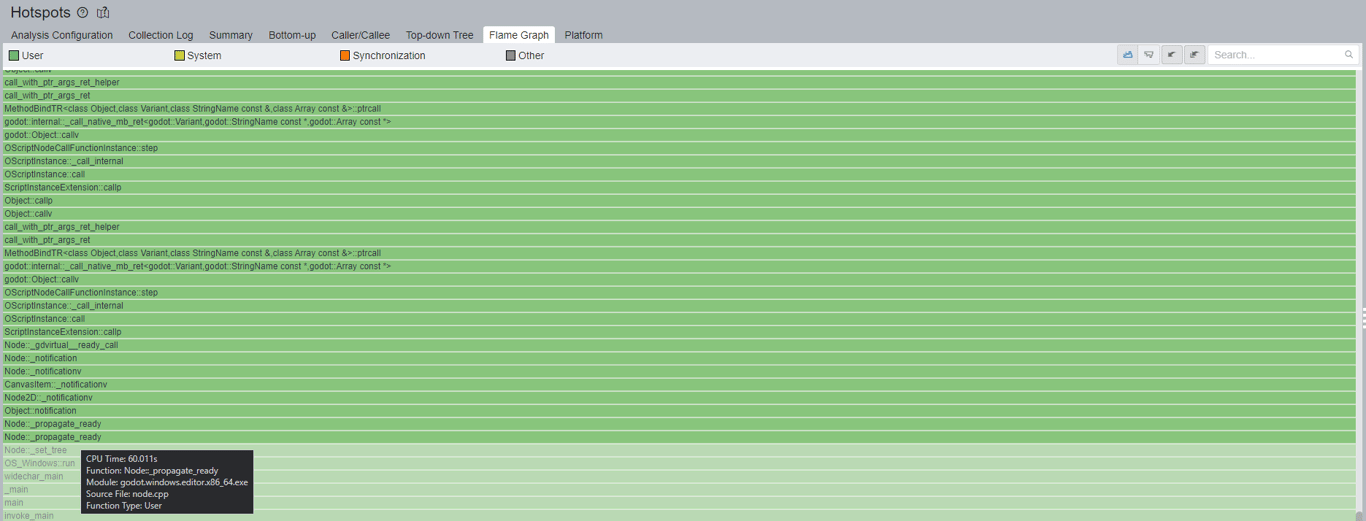
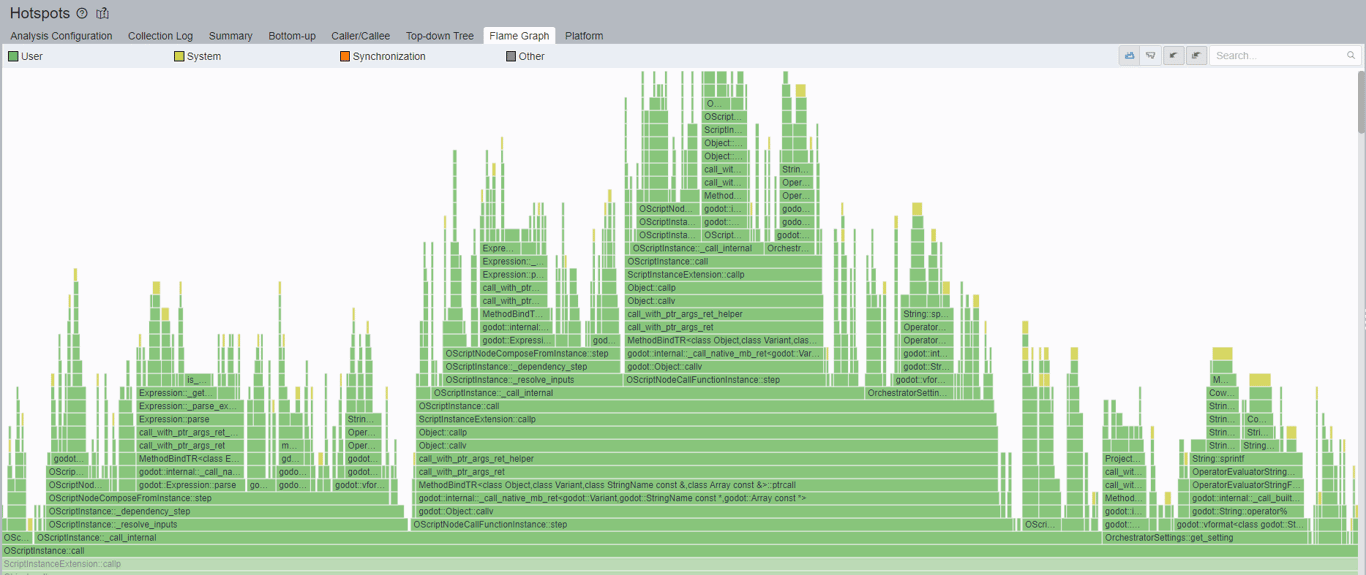
There are two critical places I look inside VTune. The first is the Flame Graph, which visually represents the call stacks and their duration. As call stacks are made recursively, the graph grows upward. As our code specifically runs inside the _ready function, I'm going to only ever focus on the Node::_propagate_ready part of the graph and upward, shown below:
Now as I scroll up to the top of the flame graph, I can begin to see parts of the recursion call stack that are taking smaller slices of time of the overall _ready call:
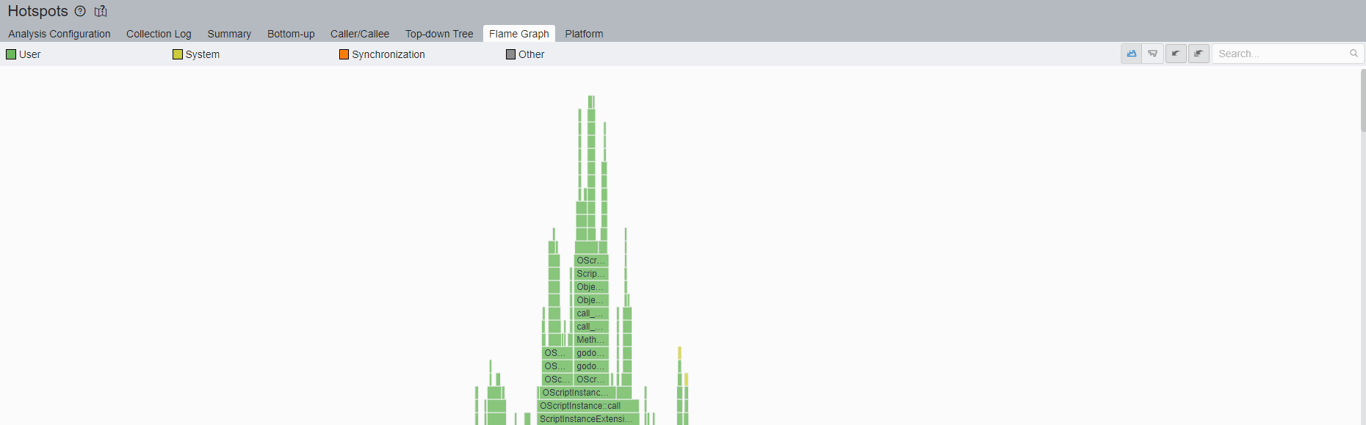
Clicking on the OScriptInstance::call bar shown in the middle will zoom in and give a better view of the function call layouts.
Immediately, one thing caught my attention, and that is a bar labeled OrchestratorSettings. It appears we are calling into the plug-in settings on each iteration of the function call. If I click on that specific bar, a lot is going on underneath that function call:
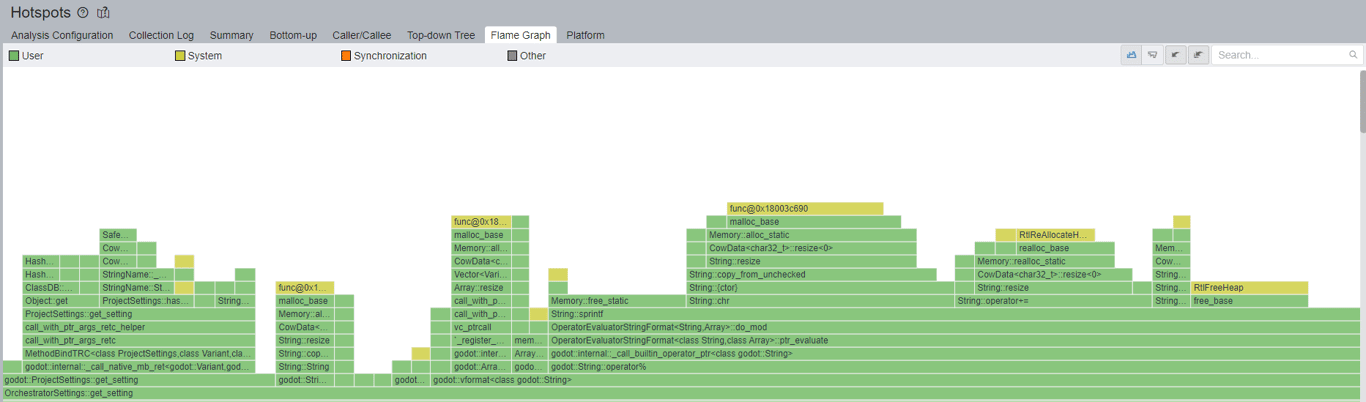
Multiple string-based operations are happening here, including numerous calls to the operating system to allocate and free memory. These can be expensive when done recursively, so we should see how to improve this. I have set up VTune to know the path of the source code for Orchestrator. This allows clicking on the call stack on the right panel of this view and navigating to the code to understand what is happening.
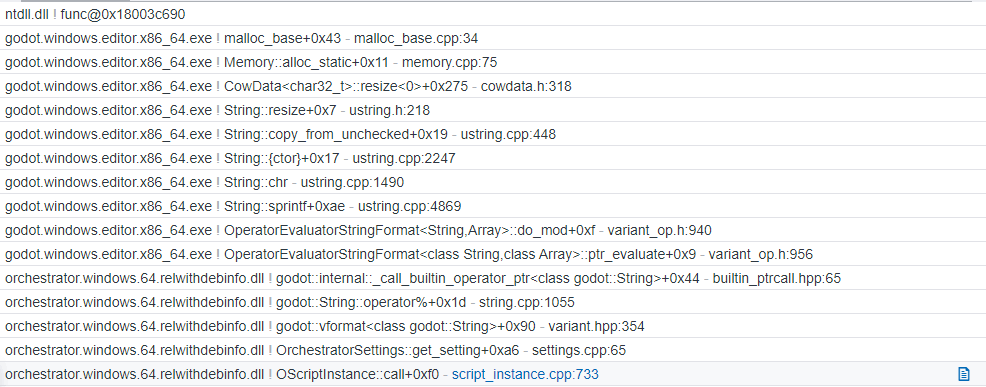
Clicking on the script_instance.cpp:733 link opens the source code view, and I can immediately see the problem lines of code:
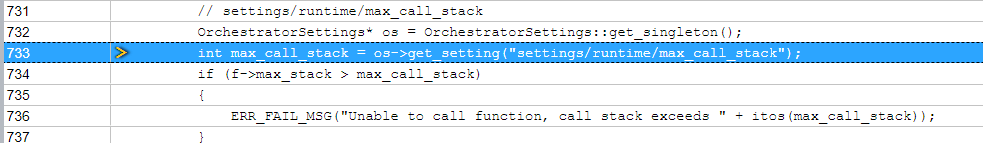
Further analysis of the code illustrates that the only purpose of the call into OrchestratorSettings services is to fetch this configured settings/runtime/max_call_stack value and compare it against the function's call stack size, raising an error if the function's stack exceeds the value. Since this value doesn't change at runtime, there is no reason for fetching this on each function call; instead, it could be cached when the script instance is constructed to save CPU cycles, reducing 0.692s of CPU time consumed for each function executed.
After creating a member variable called _max_call_stack and initializing the value once in the OScriptInstance constructor, and then accessing the value via the member variable instead, we can already see a substantial improvement.
| Iterations | Original Time | Original Difference | New Time | New Difference | Savings |
|---|---|---|---|---|---|
| 30 | 56.39600014686858s | +53.16800022125524s | 36.59899977111118s | +33.37100005149834s | 16.57s |
In other words, Orchestrator is now 11.34 times (1133.8%) slower than GDScript rather than 17.5 (1747.1%), and that is only by making one single change.
The Flame Graph isn't the only way to identify these problems. In VTune, there is another tab called Bottom-up, designed to show a similar result but in tabular form, which may be easier for some to digest.
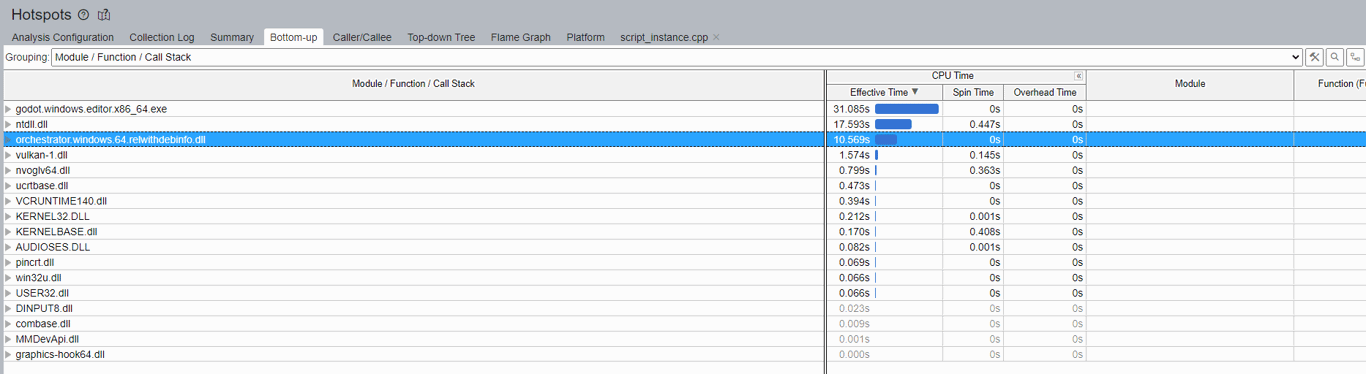
In this view, I prefer to localize the view to only the library I am working on. At the bottom of the view is a drop-down labeled Module; I will select the Orchestrator library. By doing this, the view will change, and we'll only see the bits related to the Orchestrator plug-in, shown below:
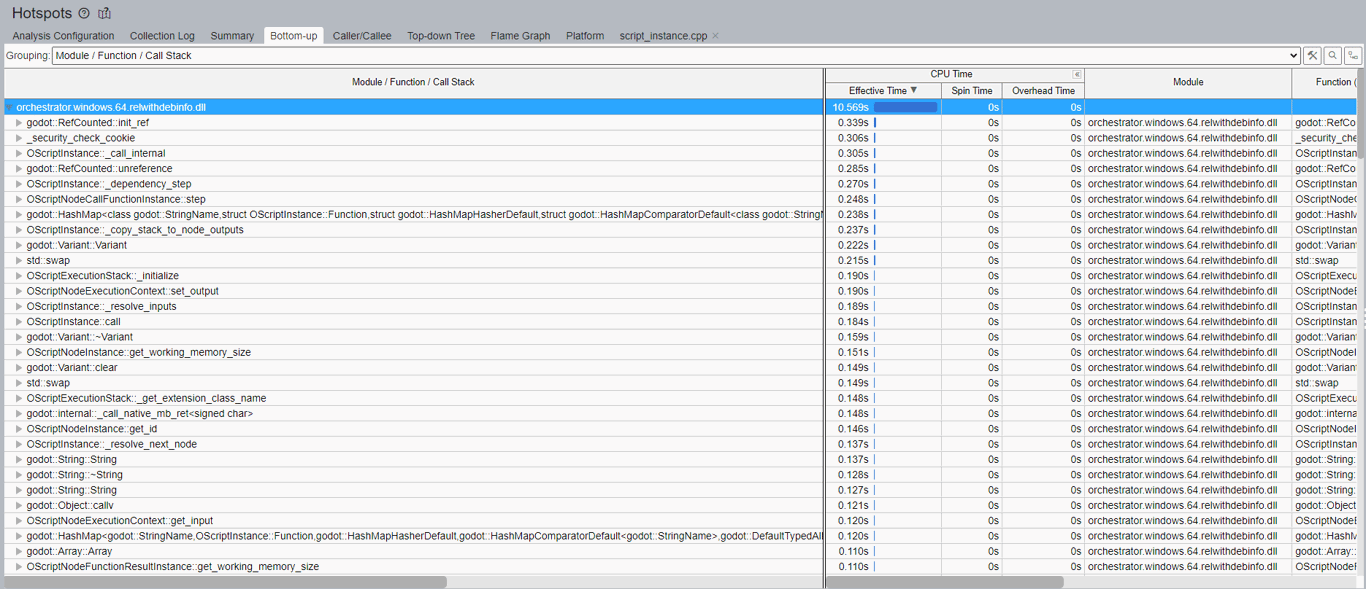
This view helps to identify which function calls consume the most time given the program's parameters. We can see RefCounted::init_ref takes the most time, and by expanding its sub-tree, we can see specifically which parts of the code invoke this function and why. Similarly, we can also see that RefCounted::unreference consumes quite a bit of time, clearly making a point that using godot::RefCounted is likely not a great idea except where necessary.
By continuing to review this chart, we can see lookups of godot::HashMap, multiple allocations, and deallocations of godot::String, godot::StringName, and godot::Array all consume valuable CPU time that can be optimized. There are many opportunities to optimize here, and in the next section, we'll cover the results of our efforts and how Orchestrator performs against GDScript.
Results
So, after looking at the major problems, the final comparison is as follows:
| Iteration(s) | GDScript Time | Orchestrator Time | Difference |
|---|---|---|---|
| 1 to 13 | 0s | 0s | 0.0000000s |
| 14 | 0.00099992752075s | 0.00099992752075s | 0.0000000s |
| 15 | 0.00200009346008s | 0.0019998550415s | 0.0000001s |
| 20 | 0.02599978446960s | 0.02600002288818s | 0.0000001s |
| 25 | 0.28500008583069s | 0.30400013923645s | 0.019000s |
| 30 | 3.22799925613400s | 3.26800012588501s | 0.040002s |
As we can see, Orchestrator is nearly identical to GDScript and is substantially smaller than when we started. A considerable portion of this improvement lies within five critical changes that equate to approximately a 40-second savings:
- Rework of the ComposeFrom node's behavior
- Avoid unnecessary lookups of the settings/runtime/max_call_stack project setting at runtime.
- Rework the execution stack.
- Minimize function result copy operations.
- Cache previous function calls to minimize hash-map lookups.
After all the changes listed below, Orchestrator is now only 1.24% slower than GDScript, a tremendous improvement over the original value of 1647%, which is a 1645.76% speed improvement.
Next Steps
In the following section, you can see a detailed list of the changes we have made to come to realize the performance improvements discussed; however, this is only scratching the surface. Although we plan to continue our efforts on performance optimizations as we proceed through the development cycle of Orchestrator 2, we believe this brings us to an excellent point for Orchestrator 2.0.dev3. You can expect all these improvements and more!
List of changes
-
Rework the ComposeFrom node to avoid using string-based manipulation for composing Boolean, Integer, Float, String, StringName values (~ 18.2s savings).
-
For each Orchestrator script instance, the settings/runtime/max_call_stack project setting is now cached in the instance constructor and reused across function calls (~ 16.57s savings).
-
Allocate the OScriptExecutionStack wrapper on the stack and use alloca vs malloc (~ 6s savings).
-
Significantly reworked the CallFunction node, avoiding the allocation and deallocation of godot::StringName instances, reducing the allocation and deallocation of godot::Array for function arguments, and cached the Godot instance owner pointer to avoid the virtual function overhead (~ 2.8-2.9s savings).
-
Reworked the Orchestrator script node instances to use the cached node identifier rather than delegating to the underlying node resource's function call, avoiding a Ref
dereference call (~ 2.8-2.9s savings). -
Replaced the usage of PackedStringArray with std::vector in the SwitchOnInteger node, which meant we applied the conversion from godot::String to int once during the script's load phase. Additionally, pairing with std::lower_bound and std::distance for look-ups (~ 2.6s savings).
-
Reduce the overhead of calling clear_error() on the execution context by only resetting the state if the error code does not equal GDEXTENSION_CALL_OK. This avoids deallocation and reallocation of godot::String instances (~ 1s savings).
-
Removed usages of the Godot ERR_FAIL_XXX macros with release builds from the script's execution context. While these are overall helpful, they tend to have significantly less involvement in release builds as they're mainly there to focus on identifying failure conditions during development (~ .25-.3s savings).
-
Cache script node instance lookup to function declarations (~ .2s savings).
-
Most script nodes do not utilize a working memory register, so most nodes now reuse the same allocated empty register rather than always allocating an empty register when get_working_memory() is called (~ .1-.3s savings).
-
Improve result calculation of Operator node (~ .12s savings).
-
Allow function graphs to contain multiple FunctionResult nodes. While this has no direct improvement on the timings, it allows users to design more efficient node paths, indirectly improving the graph's performance.